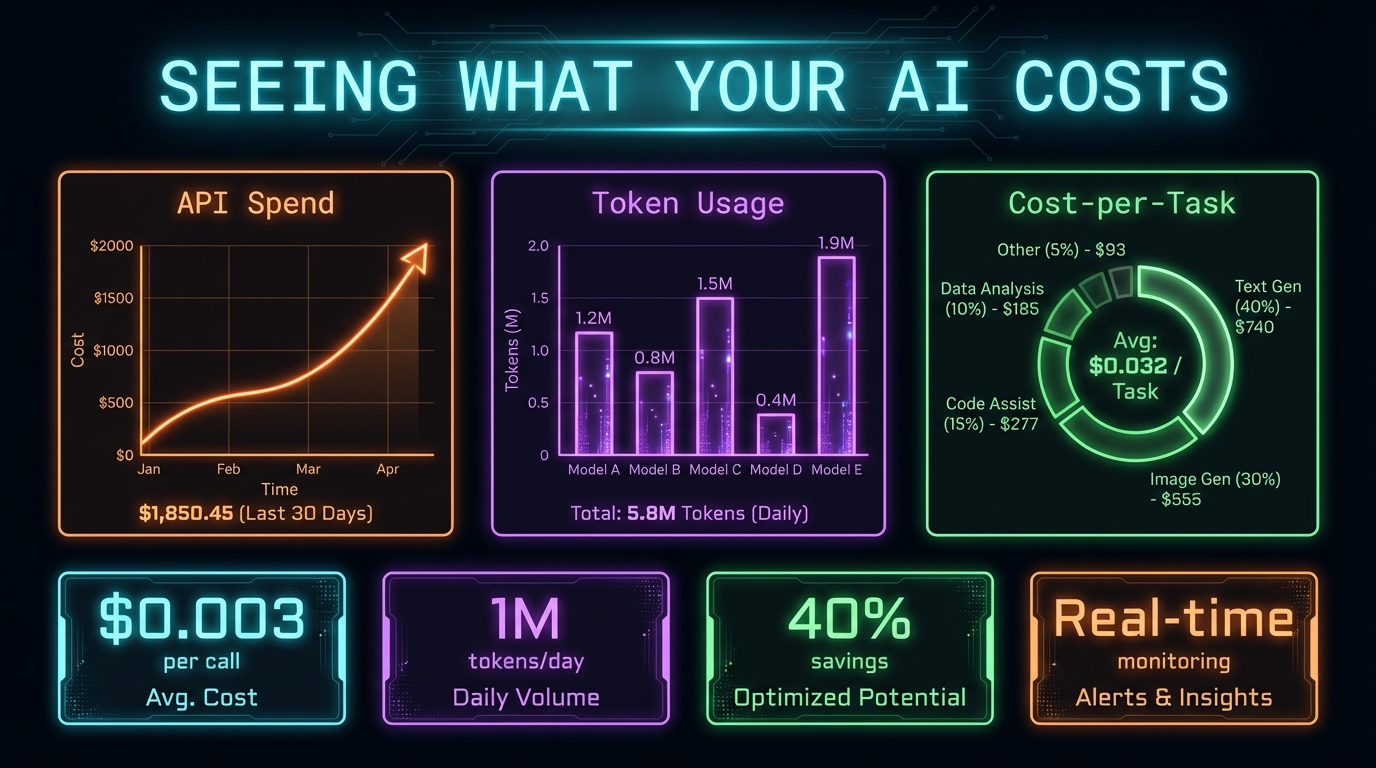
Seeing What Your AI Actually Costs
Seeing What Your AI Actually Costs
Day 7 was about operational maturity. Not new features — polish. The kind of work that makes the difference between a demo and a production system.
The Statusline
Claude Code runs in a terminal. By default, you get basic info: the model name, maybe a token count. I wanted more.
I built a custom statusline script that shows:
- Model: Which Claude model is active (Opus/Sonnet/Haiku)
- Context bar: Visual indicator of how much of the context window is consumed
- Cost: Running cost of the current session
- Session name: Human-readable identifier
- Git branch: When inside a repo
- Last message: Preview of the most recent user input
The script reads Claude Code's transcript files (JSONL format — one JSON object per line) and extracts token counts and cost data.
macOS Gotchas
Building the statusline surfaced two macOS-specific bugs:
1. `tac` doesn't exist on macOS. The GNU `tac` command (reverse file lines) isn't available. The macOS equivalent is `tail -r`. Small thing, but it broke the script completely.
```bash
Linux
tac transcript.jsonl | head -1
macOS
tail -r transcript.jsonl | head -1 ```
2. Transcript files are JSONL, not JSON. Each line is a separate JSON object. Using `jq` with its normal array syntax (`.[] | .field`) fails because the file isn't an array. You need line-by-line processing:
```bash
Wrong
jq -s '.[] | .costUSD' transcript.jsonl
Right
tail -1 transcript.jsonl | jq '.costUSD' ```
These are the kind of bugs that eat 2 hours and teach you to test on your actual platform, not just assume Linux compatibility.
Scheduled Automation (The Failure)
I tried to schedule agents to run automatically using macOS LaunchAgents — a 7:30 AM daily briefing and a 4:30 PM EOD summary.
It didn't work reliably. LaunchAgents run outside the user's shell environment, which means:
- Environment variables aren't set
- MCP server connections aren't established
- OAuth tokens aren't available
- The terminal context that Claude Code expects doesn't exist
I removed the scheduled automations after a day of debugging. The lesson: Claude Code agents are interactive tools, not background daemons. They work best when triggered by a human in a live terminal session.
Self-Auditing Config
I created a skill called `review-claudemd` that audits my CLAUDE.md file against recent conversation patterns. It looks for:
- Instructions that are being violated (rules I wrote but the AI ignores)
- Missing rules (patterns I enforce manually but haven't documented)
- Outdated entries (references to features or workflows that have changed)
This meta-capability — an AI that reviews its own configuration — turned out to be surprisingly useful. CLAUDE.md grows organically and develops inconsistencies. Periodic auditing catches drift before it causes problems.
VIP Defect Tracking
I also integrated a new data source: a Google Sheet maintained by the QA lead that tracks high-priority defects. I wired it into the morning briefing agent (conditional: only fires when the calendar has relevant meetings) and into the triage skill.
This is the pattern: find a data source that someone maintains manually, wire it into an agent, and let the agent surface it contextually. The data was always available — the agent just makes sure I see it when it matters.
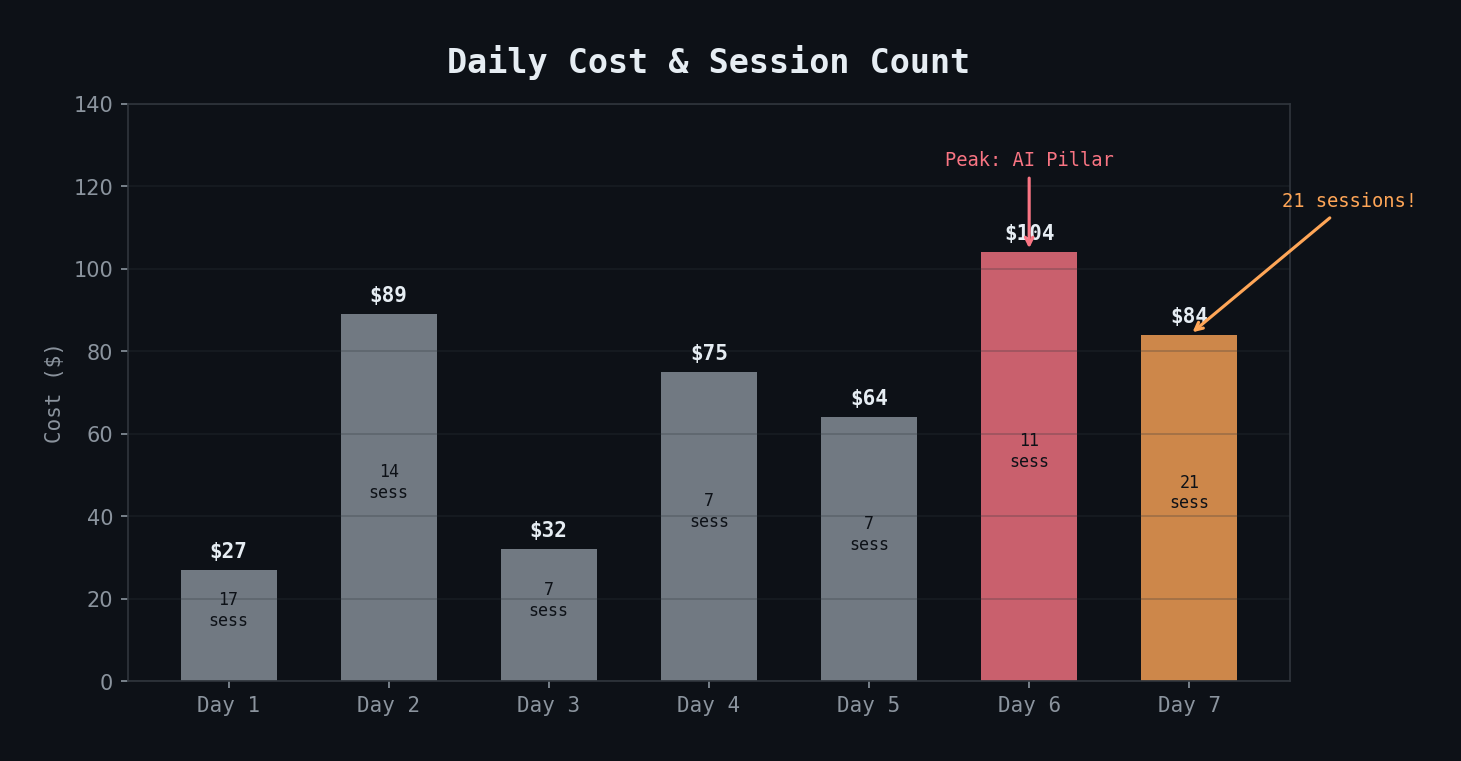
Cost: The Most Sessions, Not the Most Expensive
Day 7 had 21 sessions — the most of any day — but cost $84. Most sessions were short: testing the statusline, iterating on config, debugging LaunchAgents. The expensive operations are agent dispatches with large context, not raw session count.
Key Takeaways
- Build cost visibility early — you can't optimize what you can't see
- Test on your actual OS — macOS and Linux differences will bite you on CLI tools
- Claude Code agents aren't background jobs — they need an interactive terminal context
- Self-auditing your config (`review-claudemd`) catches drift before it causes problems
- The highest session count doesn't mean the highest cost — agent dispatches dominate, not session overhead